Project managers work in an environment that’s challenging, dynamic, and exciting. From orchestrating multiple teams to synchronizing times, you have a lot of responsibilities when managing your project.
Let Vectorworks Spotlight carry some of the burden so you can efficiently keep track of all your data.
In this post, we'll delve into the indispensable role Vectorworks Spotlight can play in data management. Welcome to the intersection of creativity and precision in the world of project management.
Data-Driven Features in Vectorworks Spotlight
Below, you’ll find just a few of the features that can assist your management efforts. Within each section, you’ll also find a link to learn more about the feature, tool, or command in the Vectorworks Online Help System.
Record Formats
Custom record formats are a surefire way to manage your project’s cost, logistics, and more, as well as share pertinent information with your production staff. Record formats are attached to objects and can then be used to create all sorts of useful data reports based on your project objects.
To create a record format, start in your Resource Manager and then select New Resource. From there, select Record Format from the tool bar, and click New Record Format.
The Create Record Format dialog box should then open for you.
Next, enter the name of your custom record. Name this whatever lets you keep track of all your record formats, but we recommend following some sort of naming convention, whether it’s an office standard or a personal one.
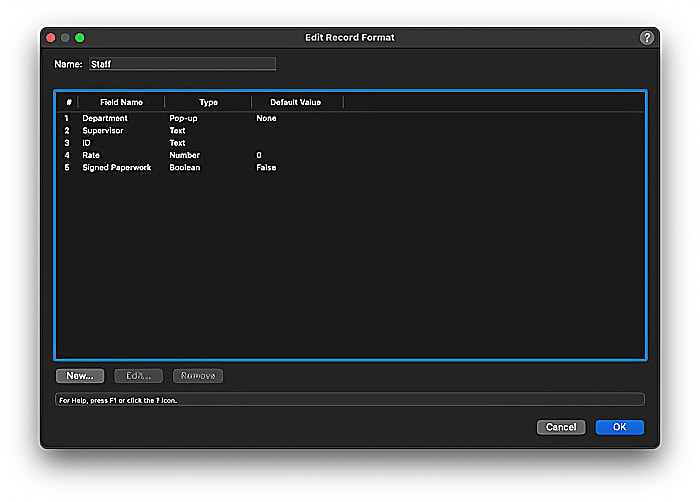
Pay close attention to your Type and Define parameters. The Type parameter allows you to specify the type of field you wish to display for the record in the Data tab of your Object Info Palette (OIP).
Type parameters contain the following specifications:
- Integer: Field for entry of whole numbers (uses less memory than a Number field).
- Boolean: Appears in worksheet data as True or False. True is when the box is checked.
- Number: Entry of general numbers.
- Text: Field entry for a string of characters to specify your object to collaborators.
- Pop-up: List of Options to select from.
All of these options above allow you to set a Default Value.
Within the Pop-up, the option to Define will allow you to create your List Choices. If the data Type is Pop-up, it opens the Edit Choices dialog box. Here, you can enter the options to display by pressing Enter(Windows) or Return(Mac) to separate each item. If the Type is Number, it opens the Number Format dialog box, and you can simply select a format.
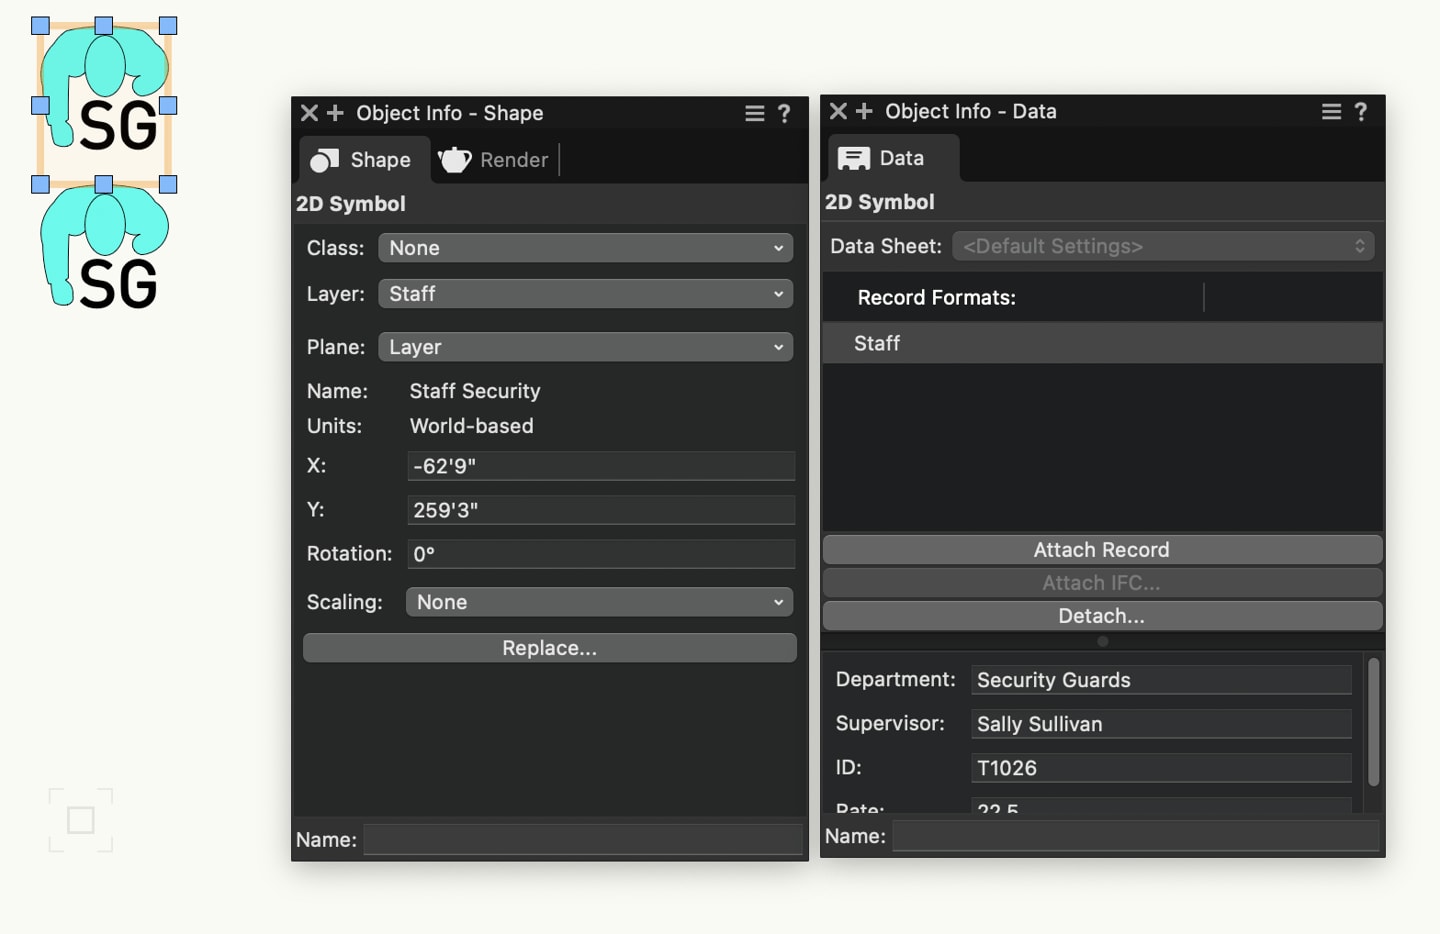
Attaching Record Formats to Objects, Symbols
You can add data to objects, existing symbol instances, and symbol definitions using one of the following:
- From the Data tab on the OIP, click Attach Record to display the Resource Selector. Select the desired record format to apply it.
- From the Resource Manager, select the desired symbol, right-click, and select Attach Record.
- Select an object(s) in your drawing, then in the Resource Manager, right-click the record format you want, and select Apply.
Click here to learn more about attaching record formats to existing design elements.
Whether you’re creating custom record formats or attaching them to essential parts of your design, they can be incredibly helpful with considerations like staff allotment.
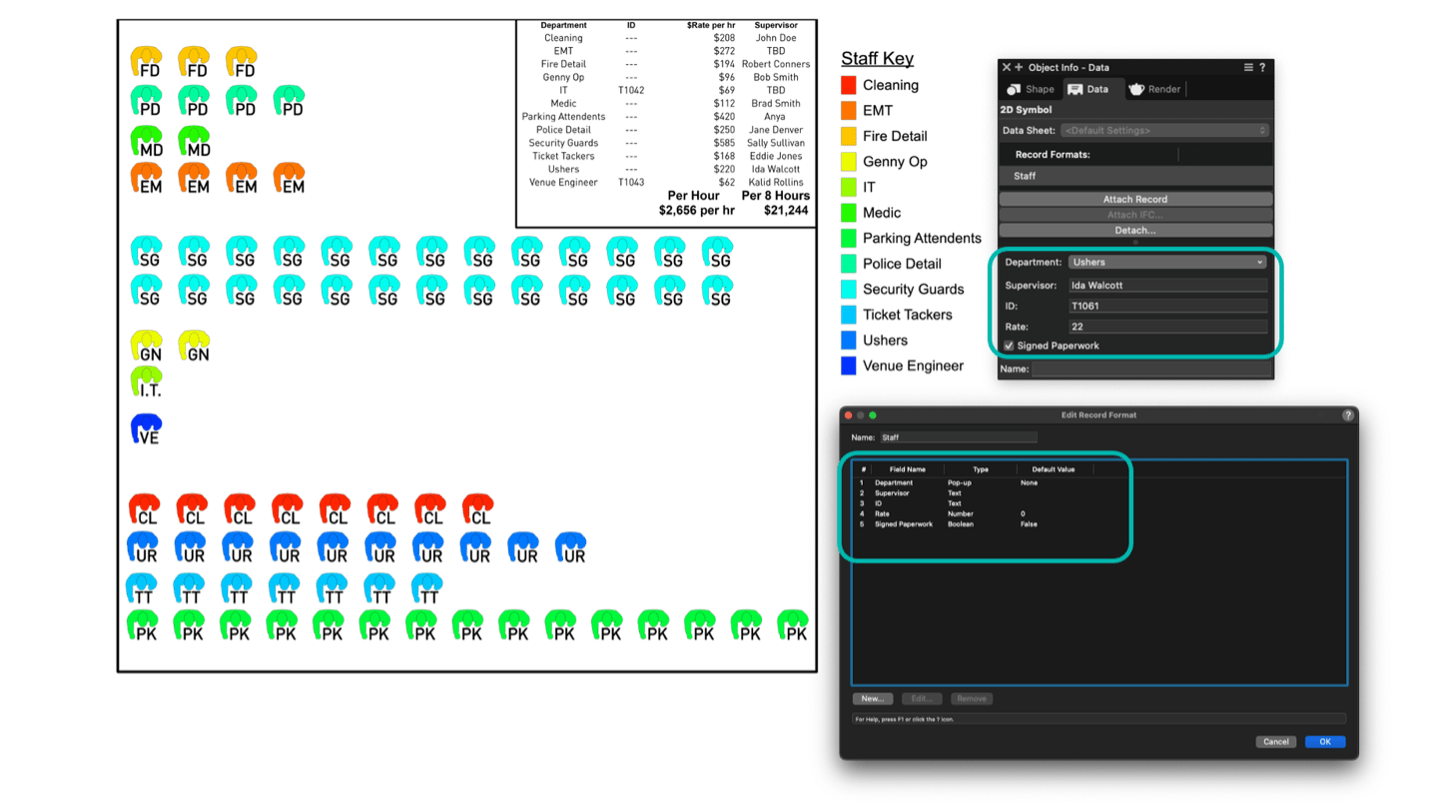
Tracking how many people are in each department for an event can be a big headache, so we recommend including parameters like location, supervisors, and day rates into your record formats.
You can then send this information off to all parties as a sheet layer worksheet or a .CSV file to a program like Microsoft Excel.
Data Tags
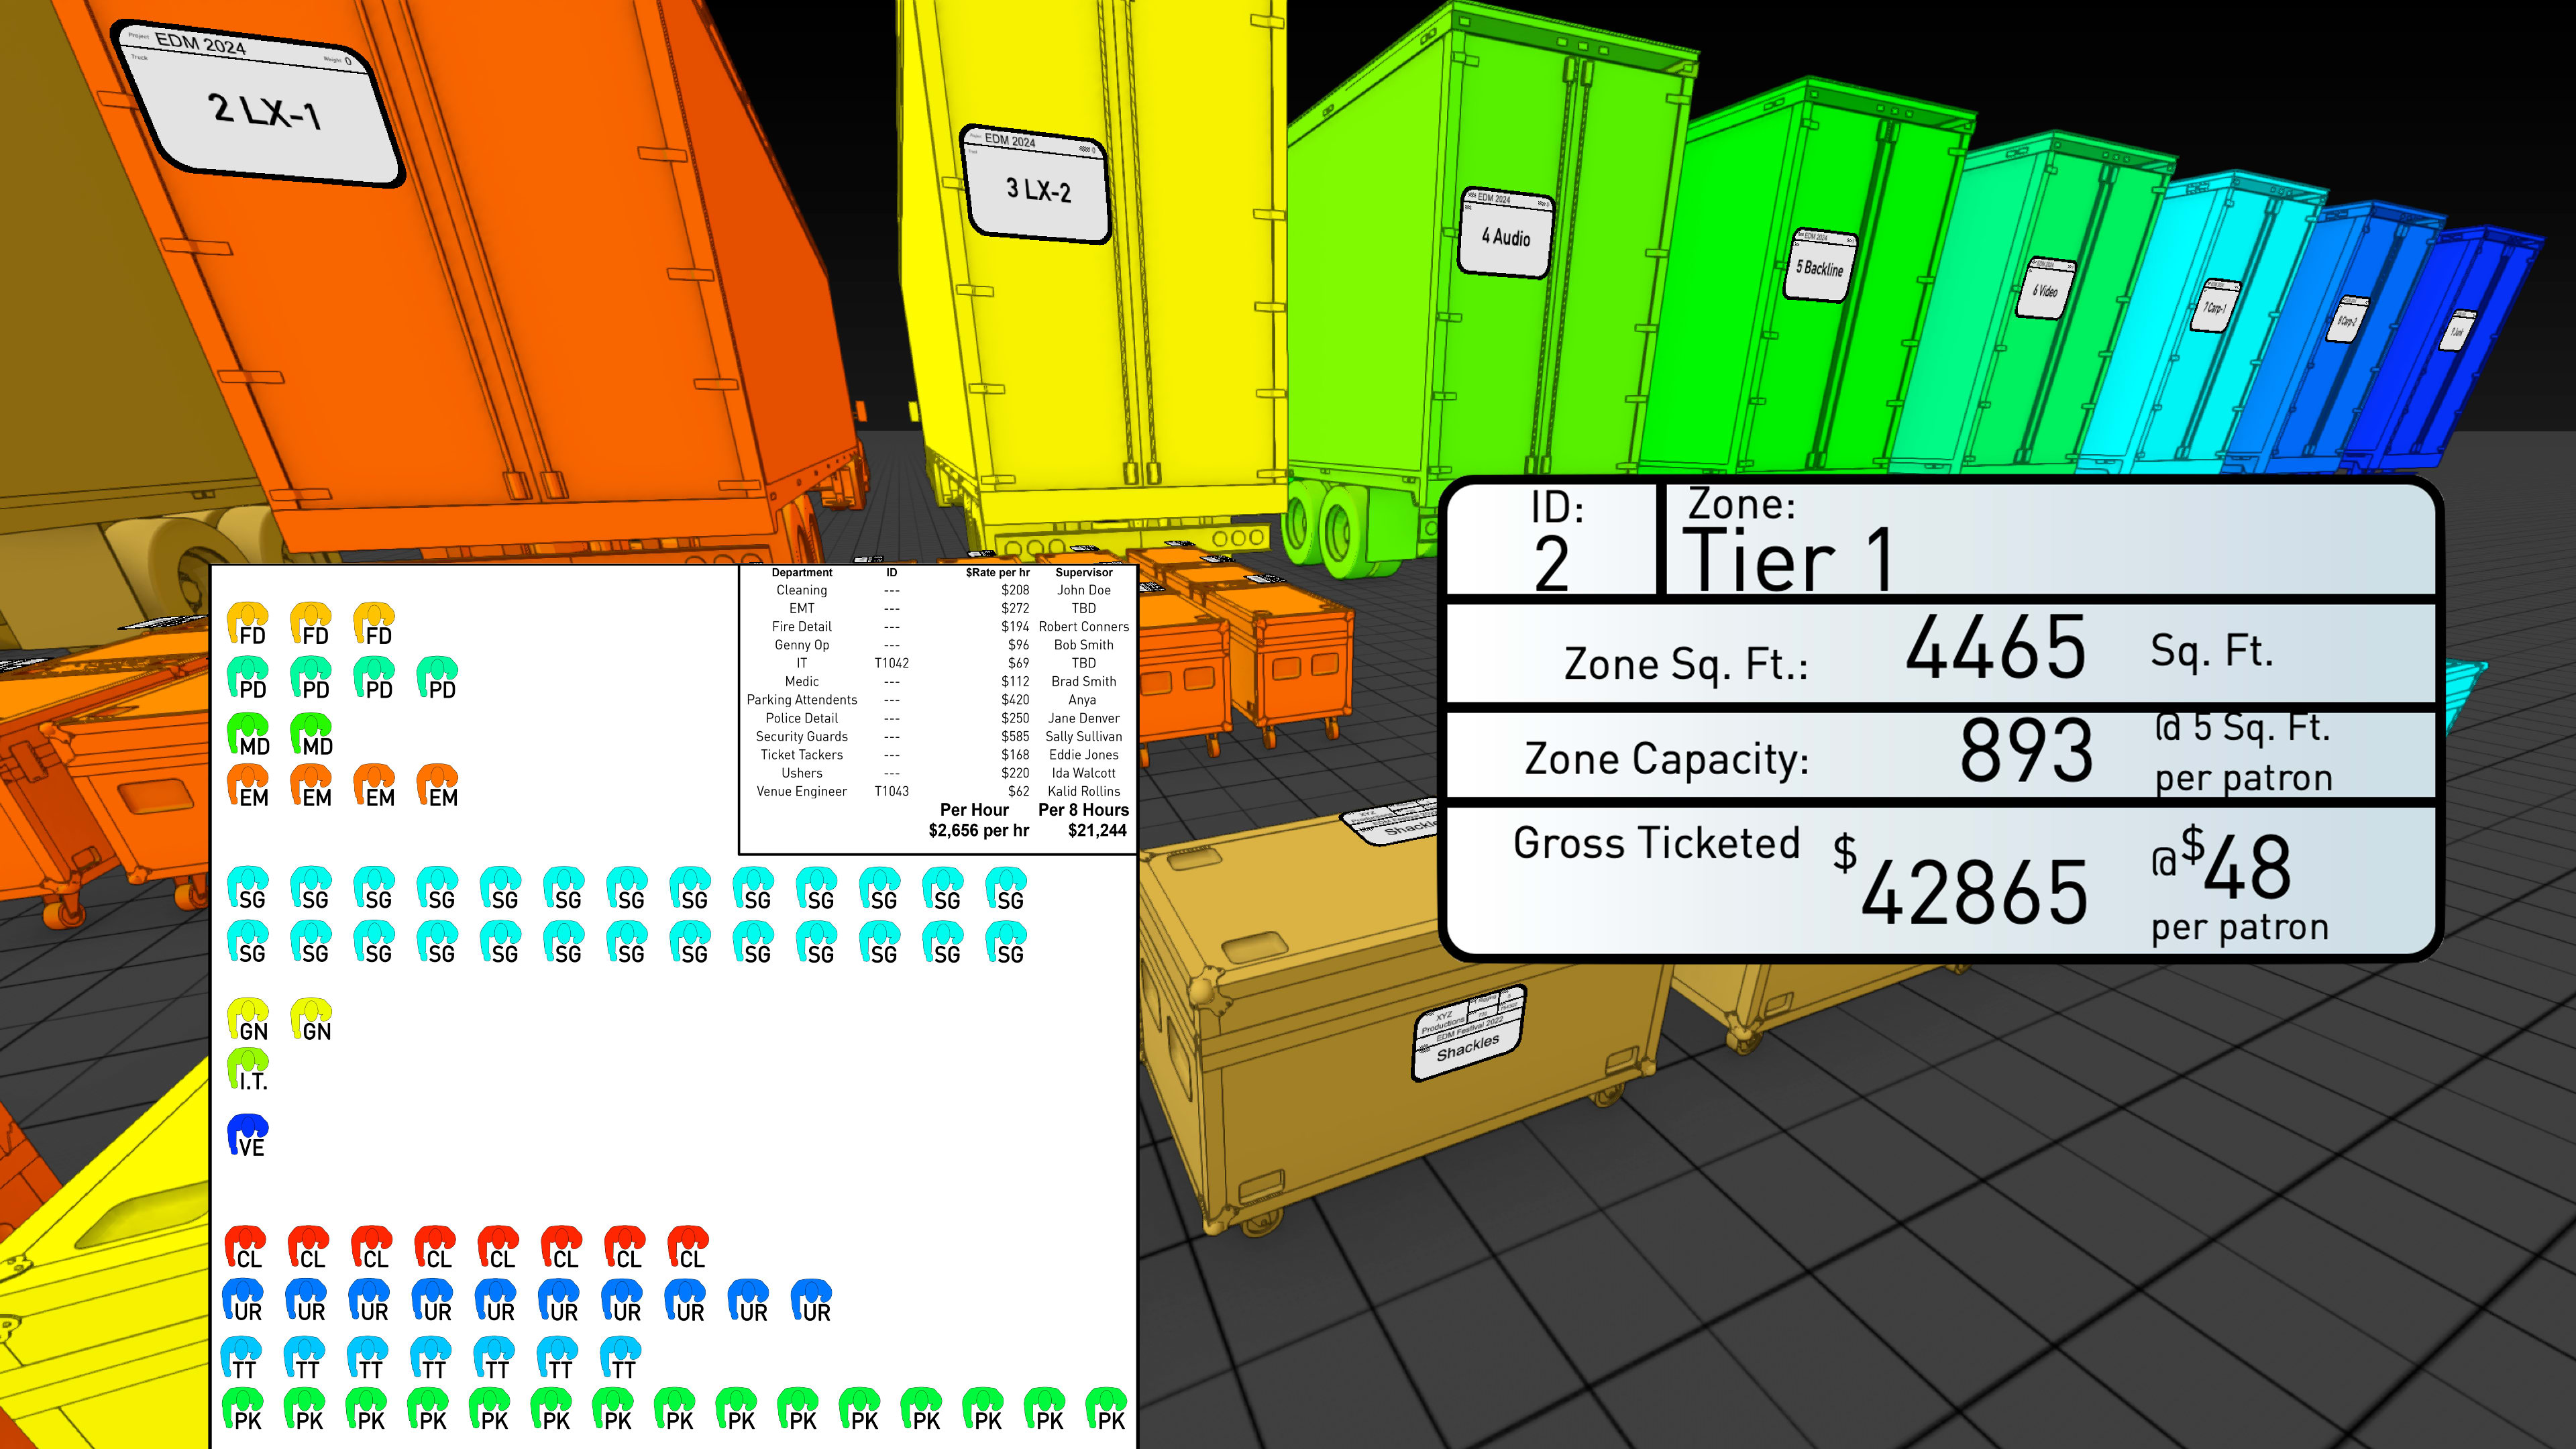
You may also have to deal with occupancy zones for an event, or perhaps how many tickets can be sold in a particular area. To help keep track of these limits, use the Data Tag tool to annotate data associated with objects in your drawing. Data tags are bidirectional, so updating your geometry updates your tags and vice versa.
To create a Data Tag Style, select a specified object like a lighting device, hoist, or truss, go to your Tools menu, and select Create Data Tag Style.
From there, a dialog box will appear where you can name the style and select property data, record format data, and more. If you edit the style after you create it or via the Resource Manager, you’ll be able to easily adjust the placement of your tags through the Tag Layout option.
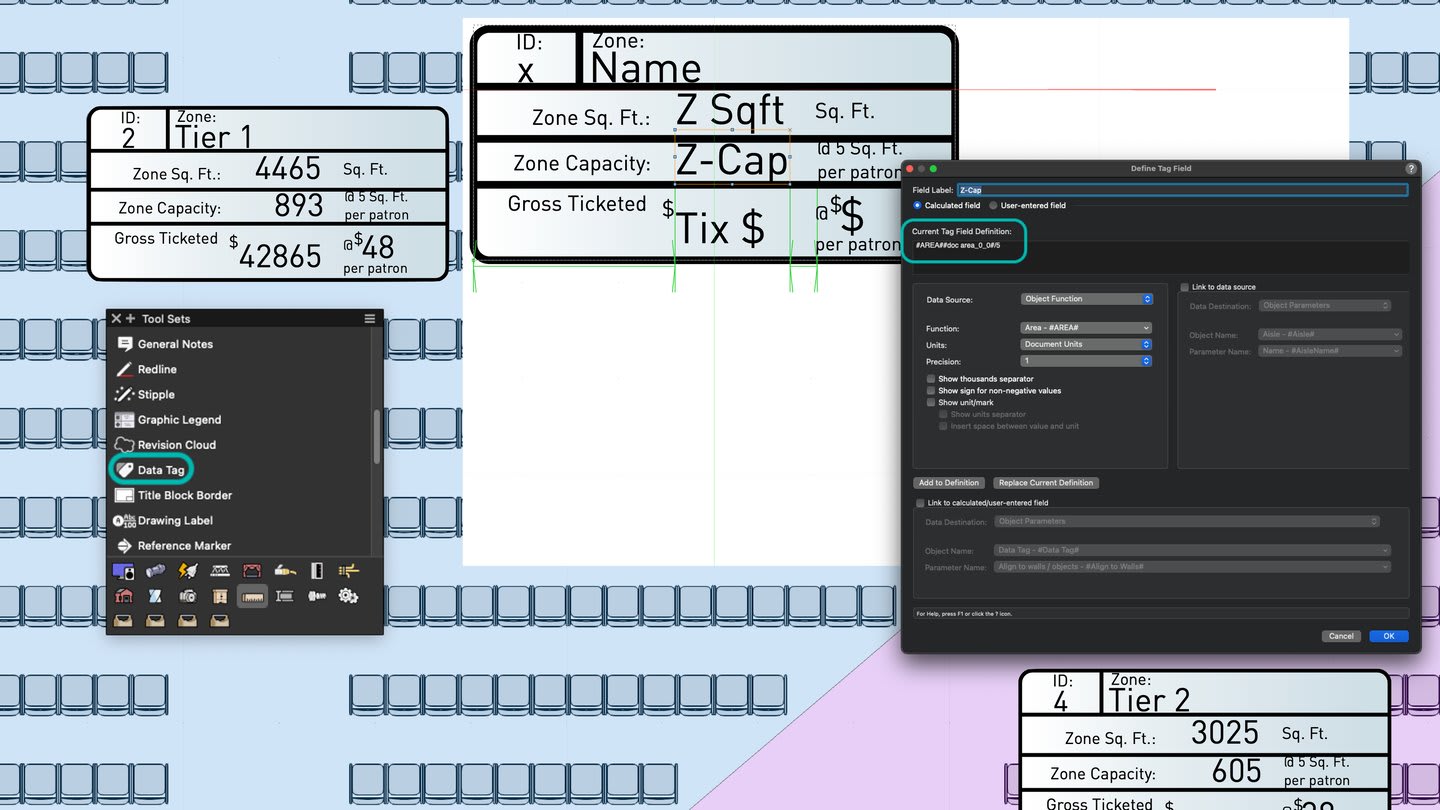
If you want to add text items to your data tags, use the Define Tag Field in the OIP. Within the field, you’ll also have the ability complete basic equations such as square footage per patron (like the above example) using -, +, /, or * to complete basic equations.
Data Visualization
For some of your collaborators, a visual representation of data may be the most digestible. This is why data visualization is one of the most useful features in Vectorworks Spotlight. Data visualization is a powerful presentation tool that interprets data embedded in your design’s objects and uses that data so you can color-code them.
In Vectorworks 2024, you can create data visualizations by selecting Visualization in the View menu. From there, you can click New, Edit, and Manage for any data visualizations. You can also search for visualizations in your current file, User Folder, and defaults in the Vectorworks Libraries.
Your Data Visualization menu is only available when a design layer is active; within sheet layers, your visualizations are applied as viewport with the Data Visualization dropdown in the OIP.
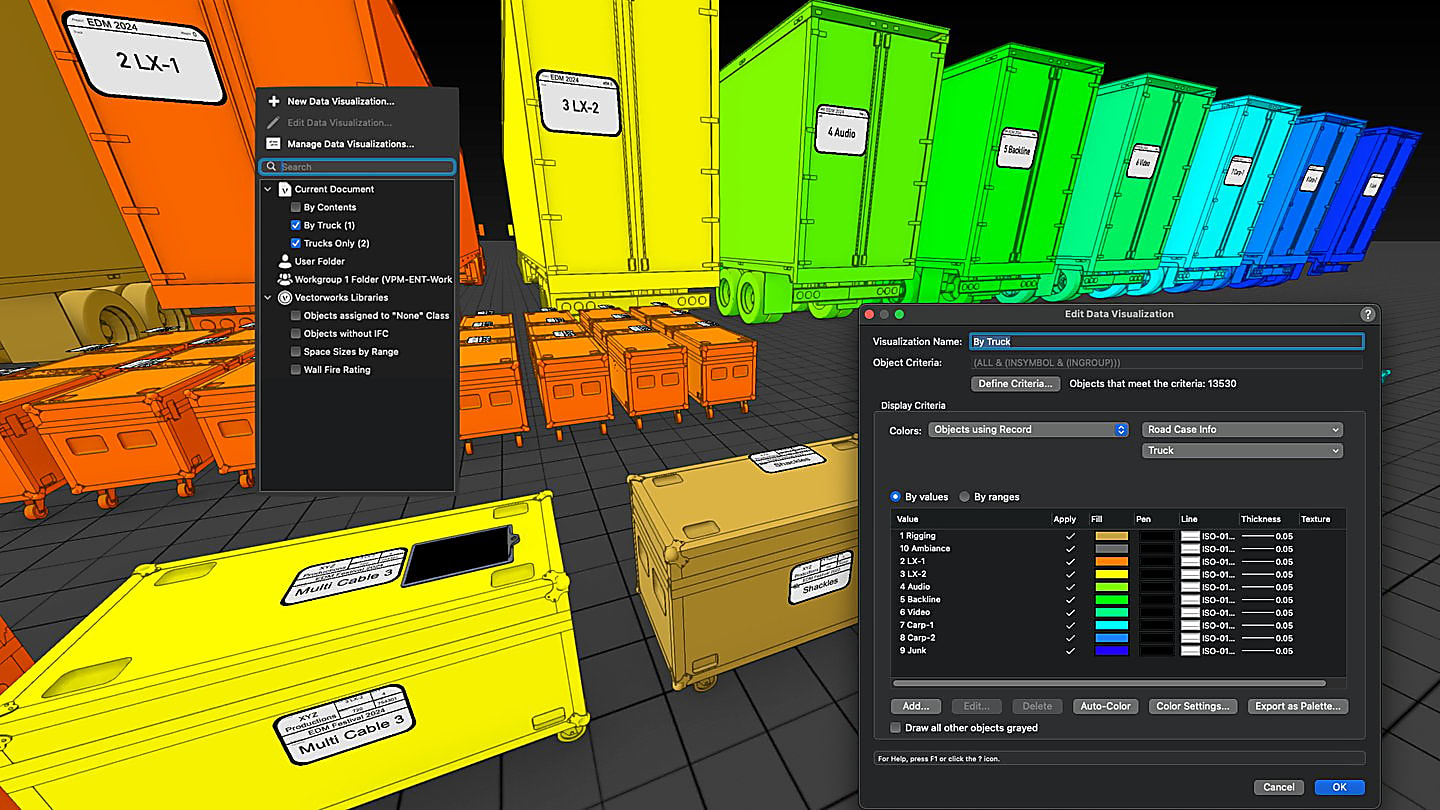
With the New/Edit Data Visualization dialog box, you can set criteria such as layers, objects, and textures with ease. Then, once your criteria is defined, select the display criteria from the Colors list — this lets you determine values or ranges of values to be differentiated by color or any other attribute.
This dialog will populate all the pertinent parameter criteria in your file, and then you can select the graphical attributes you want to apply.
Click here to dive deeper into data visualization on the Vectorworks Online Help System.
Witness Data-Driven Design in Action
As you can see, with features like record formats, the Data Tag tool, and data visualizations, you can enhance your decision making and project organization — leading to better live events, stage productions, or whatever it is you’re managing.
To see an example of such data-focused project management, click below to watch a free webinar:
Stay in the know with the latest insights
Subscribers receive news, customer stories, success and learning tips, event information, and other important announcements from Vectorworks.
By submitting this form, you agree that Vectorworks, Inc. and its authorized partners may contact you in regards to news, offers, and the use of our software, services, and platforms. Learn more about our privacy practices and your data on our privacy page.*